Ternary Diagrams
Ternary diagrams are a type of plot that represents the proportions of three variables that sum to a constant. They are often used in fields such as chemistry, geology, and materials science to visualize the composition of mixtures or the relationships between three components.
In a ternary diagram, each vertex of the triangle represents 100% of one of the three components, while the opposite edge represents 0% of that component. The position of a point within the triangle indicates the relative proportions of the three components.
To create a ternary diagram in iolite, go to the "Visualization" menu and select "Ternary Diagrams". This will open a Ternary Diagram window.
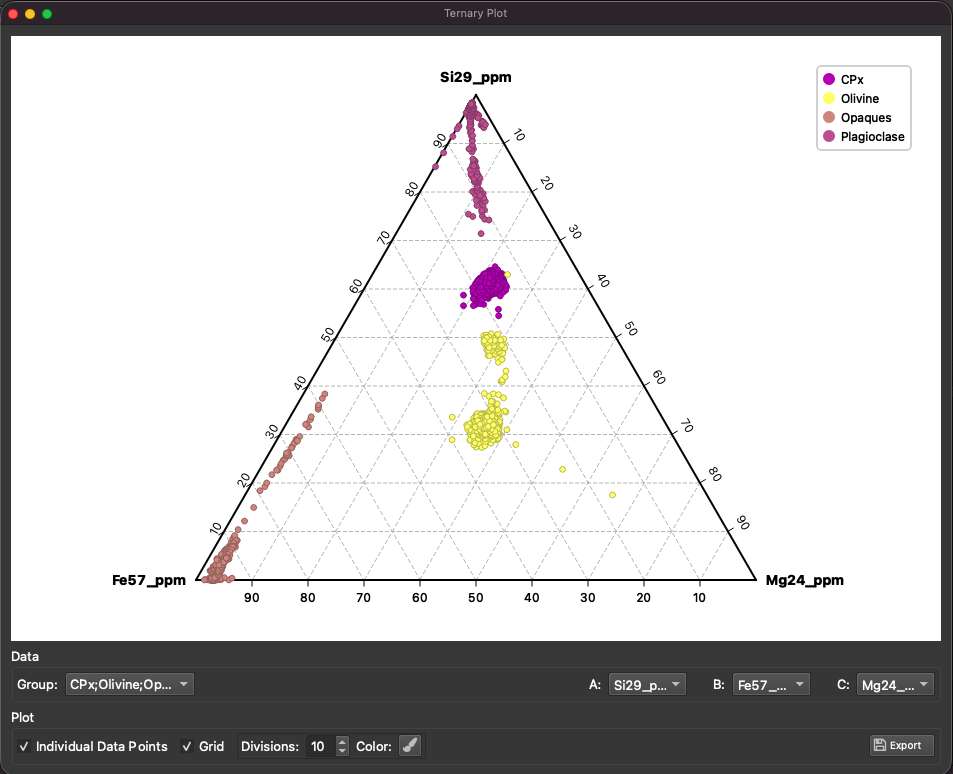
Fig. 36 Ternary Diagram Window
The Ternary Diagrams window lets you choose three channels, select one or more selection groups, and display each group as a separate series on a ternary plot.
How it works
For each point shown on the ternary diagram, iolite reads values for the three selected channels (A, B, and C), then normalizes them so they sum to 1:

These normalized values are plotted in ternary space. This means the diagram always shows relative proportions, not absolute signal size.
The plot can be drawn in two modes:
Selection averages (default): one point per selection, using the selection result for each channel.
Individual points: all time-resolved data points within each selection are plotted.
If individual point mode is used, any data point with a negative value in A, B, or C is skipped.
Controls
The main controls are:
Selection groups: choose which group(s) are shown. Each group is plotted as a separate color series. Multiple groups can be selected.
Show points: toggles between plotting selection averages (off) and plotting all individual data points within each selection (on).
A, B, C channel selectors: choose the three channels to use as ternary components. All three must be set before data can be plotted. You can select any channel, including calculated channels, but they must be numeric and have non-negative values for point mode.
Show grid: toggles display of ternary grid lines.
Grid divisions: sets the number of grid subdivisions.
Grid color: opens a color picker for the grid line color.
Export plot: exports the current plot to an image file.
Interpreting the plot
Each plotted point represents the relative contribution of A, B, and C for either a full selection (average mode) or a single sample in a selection (point mode).
Points closer to a vertex are enriched in that component.
Points along an edge indicate low contribution from the opposite component.
The currently active selection is highlighted in the plot.
Exporting the plot
Click the export button to save the current ternary diagram.
Supported formats are SVG and PNG.
If no file extension is provided, iolite uses the format selected in the save dialog.
iolite remembers the last export directory and opens that location next time.
Tip
Exporting as SVG allows for high-quality, scalable graphics that can be edited in vector graphic software. For example, you can open the SVG in Adobe Illustrator or Inkscape and adjust colors, fonts, and line styles for publication-quality figures.