Custom Color Maps
You can create your own color maps or customise existing color maps to help you present your data in the best possible way. iolite provides a tool to add/edit color maps in the Tools menu -> 'Custom Color Maps'. However, before you begin, you should be aware that creating custom color maps could lead to misinterpretation by your audience or to maps that are unreadable by those with color blindness (see this Nature paper for an overview of the science behind color scales for scientific purposes). iolite comes with the Batlow and Viridis color maps by default, but you can import additional options (described below).
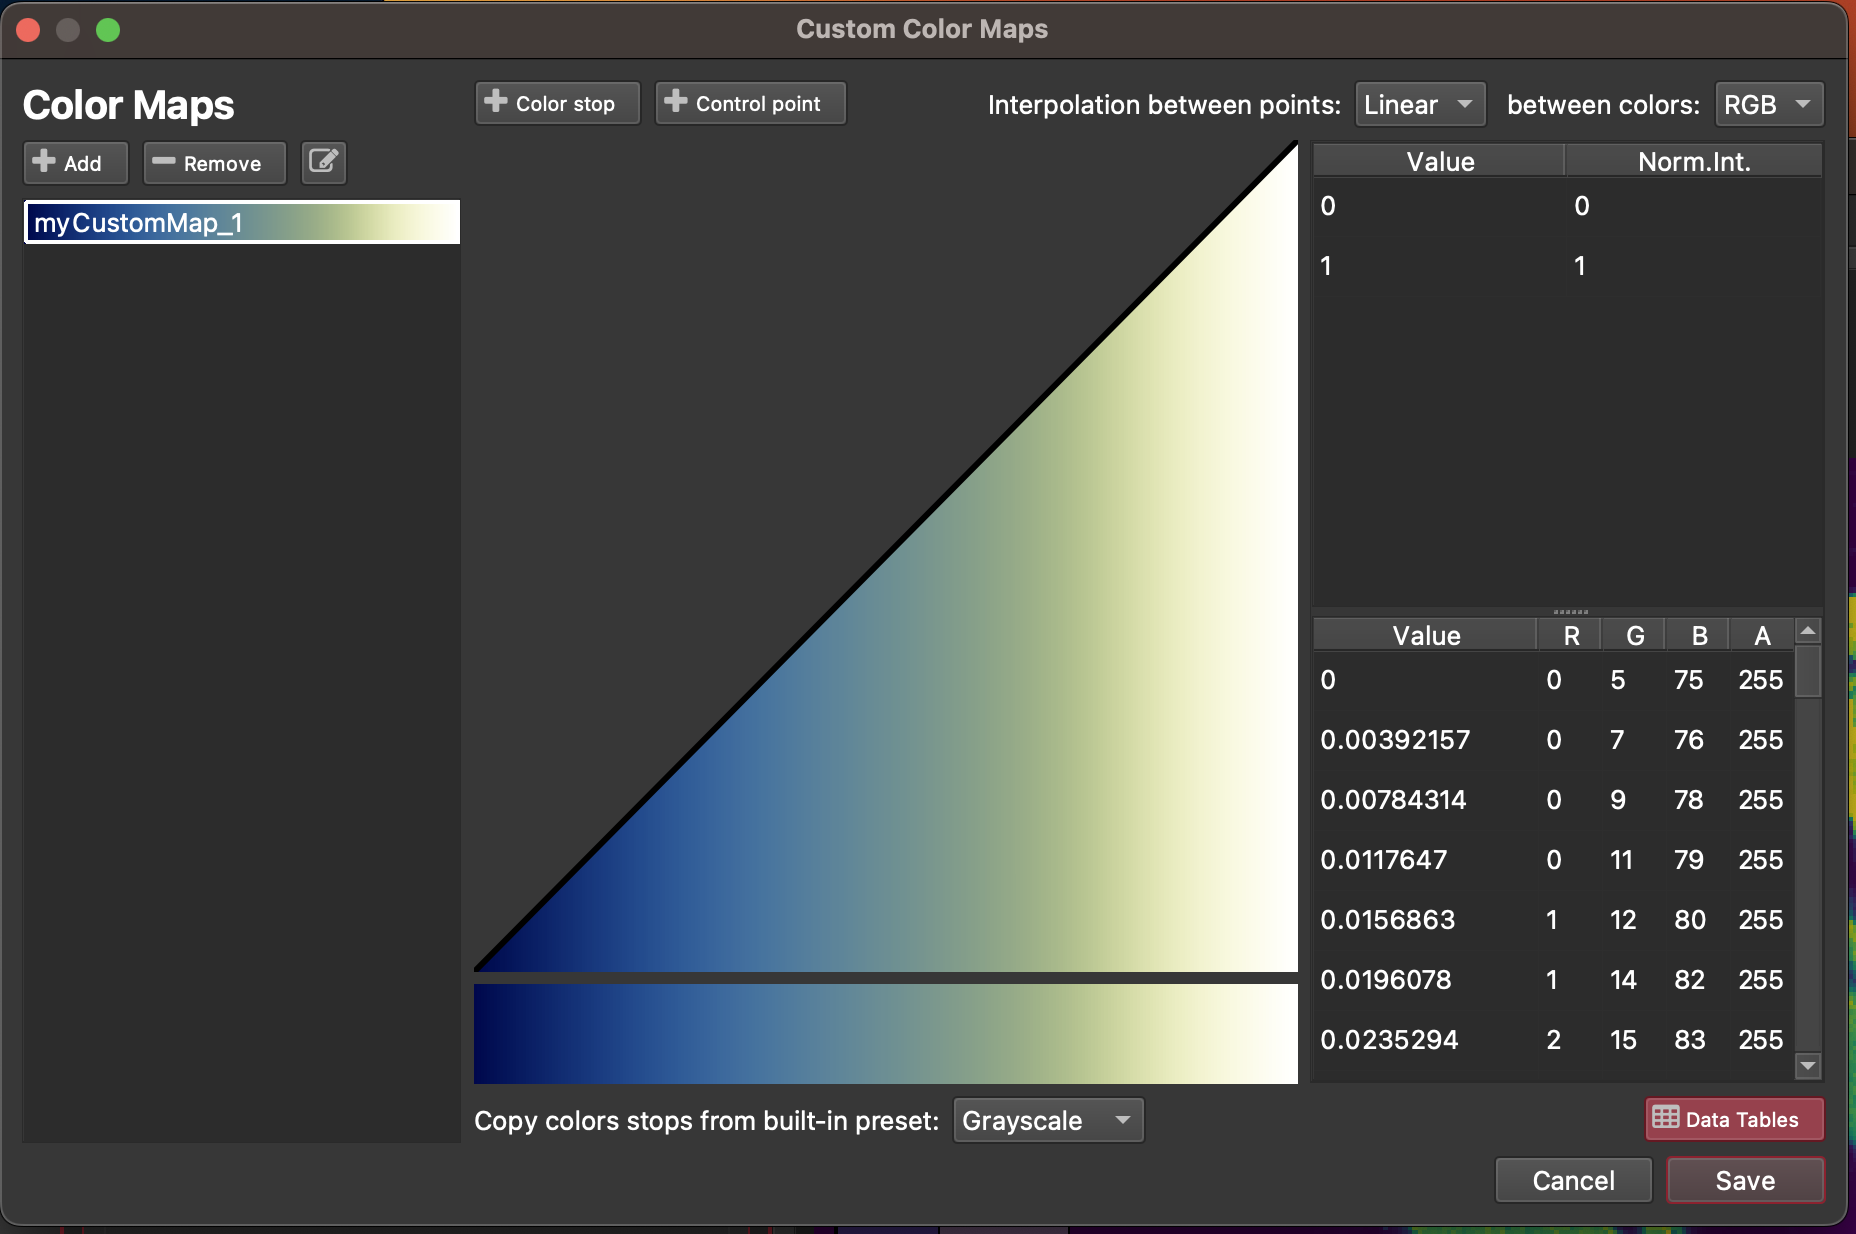
The main user interface for the tool is shown below. On the left hand side of the window there is a list of custom color maps. If you haven't created any yet this will be empty. In the middle of the window there is a plot showing the gradient and color stops for the current color map, and on the right there are two tables: one for the control points of the gradient (upper table); and another for the color stops (lower table).
Importing an Existing Color Gradient
Color maps are commonly stored and shared as text files containing the red, green and blue (RGB) components of each color stop. To import a pre-existing color map/gradient, such as those discussed in the article linked at the top of this page, start by downloading the color gradient. The Scientific Color Maps pack is available from this webpage. Unzip the gradient pack, and read the ReadMe pdf file. This pack contains each color scale in a variety of formats for a range of software packages, but iolite can read the .txt files so we'll concentrate on those (iolite can also read .lut files).
In iolite's Custom Color Maps tool, click the Add button to create a new custom color map. Label your color map and then right-click on the color stops table (lower right-hand table). This will provide options for importing text files or Excel files, or pasting data. Select 'Import text', and select the .txt file of the color map you want to import. This will populate the color table with the correct colors and you can click Save and your new color map will be available in iolite's Imaging Tab the next time you restart iolite.
Note
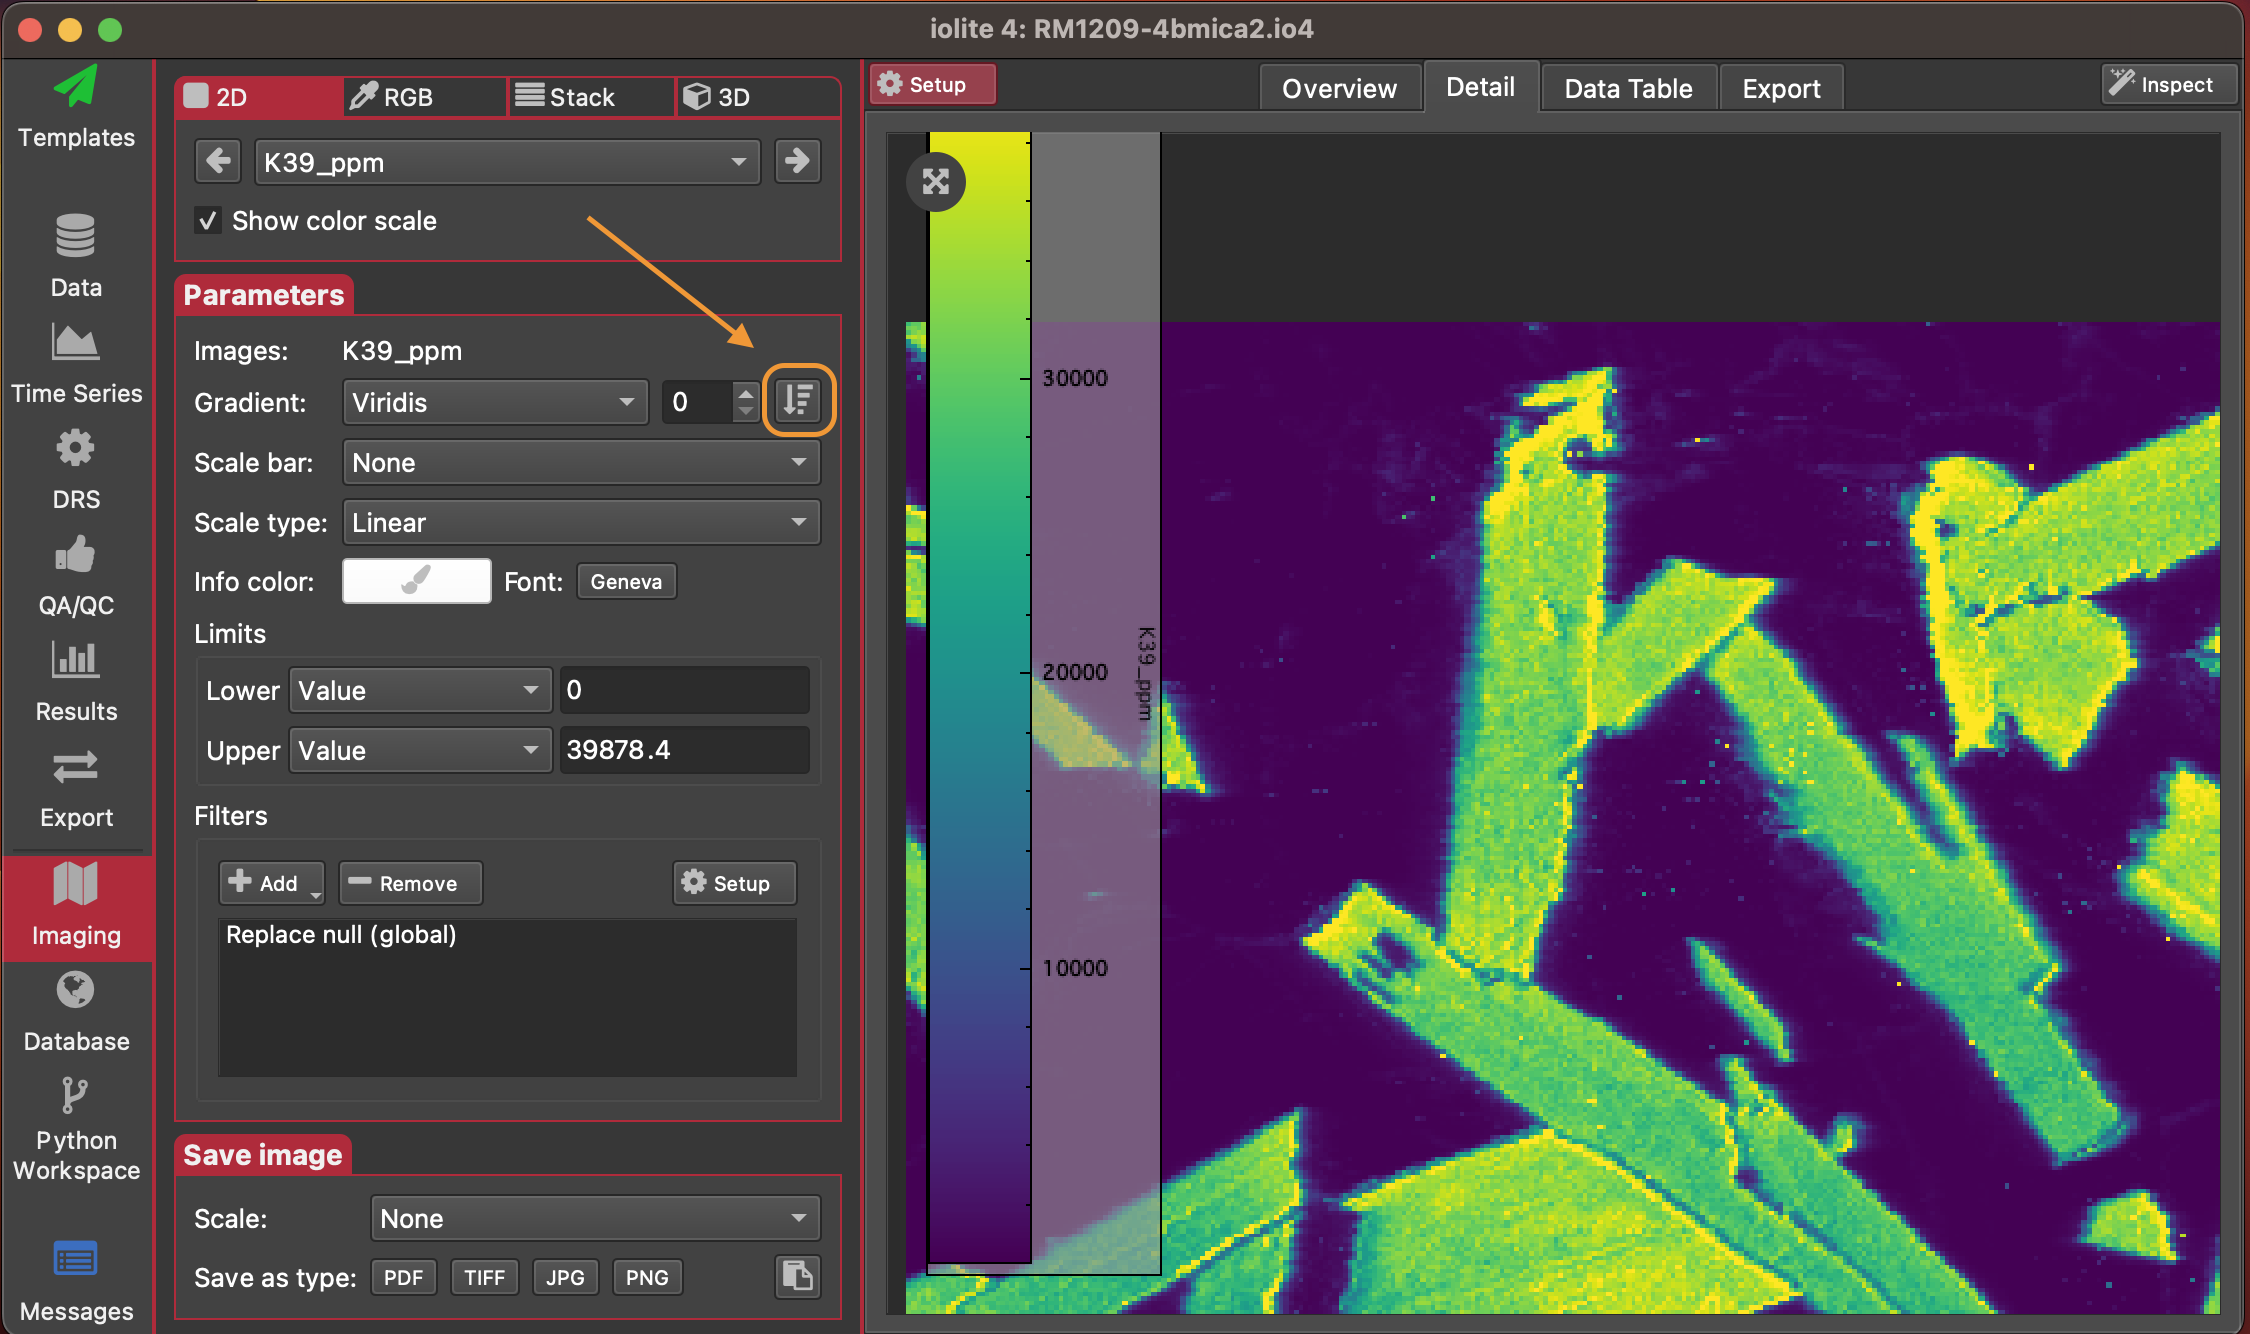
You can invert color scales in iolite Imaging Tab by clicking the Invert button (shown below). You don't need to create a separate color scale.
Editing Control Points and Color Stops
Note
Editing control points is considered an advanced feature and you should not edit color maps without understanding the principles behind them.
After creating a new custom color map by clicking the Add button, you can base your custom color map on any existing color map using the 'Copy colors from built-in preset' dropdown menu (centre bottom).
By default, each color scale has two control points: one at 0,0 and another at 1,1. The x axis in this case is the color, and the y axis is the normalised intensity value (i.e. the value calculated by

where  is the data value to calculate a normalised intensity for,
  is the minimum data value in the array/image (or the lower limit if set), and
  is the maximum data value in the array/image (or the upper limit if set).
You can add additional control points by clicking the ' Control point' button. This will add a control point on the midpoint between the last two data points. You can move this control point about by clicking and dragging it. You can remove it by right-clicking on it and selecting 'Delete control point'.
You can adjust the interpolation between control points by using the dropdown menu in the top right 'Interpolate between points'. By default this is a linear interpolation between control points, but a cubic spline can be fit to the points for a smoother gradient.
You cannot move a control point lower than the previous control point (as this would provide two possible colors for the same normalised intensity).
You can also adjust control points by entering values into the Control Points table.
Note
To produce 'logarithmic' color scales, you do not need to define a logarithmic gradient in the Custom Color Maps tool. Instead, you can select the Logarithmic Scale Type in the Imaging View.
Removing and Renaming Your Custom Color Maps
You can remove any custom color maps by selecting them in the color map list (left hand side of window) and clicking the Remove button.
You can rename a custom color map by selecting it and clicking the button at the top of the list of color maps, and entering a new name.
Saving Your Custom Color Maps
Clicking the 'Save' button (bottom right) will add the custom color scales you've created to iolite's list of color scales. You will need to restart iolite to be able to use these in iolite's Imaging Tab.
Any changes you've made up to this point will be discarded by clicking the 'Cancel' button.