Cell View
Cell View is a plugin that enables users to visualize where an analysis was in the cell along with any images collected by the laser ablation software.
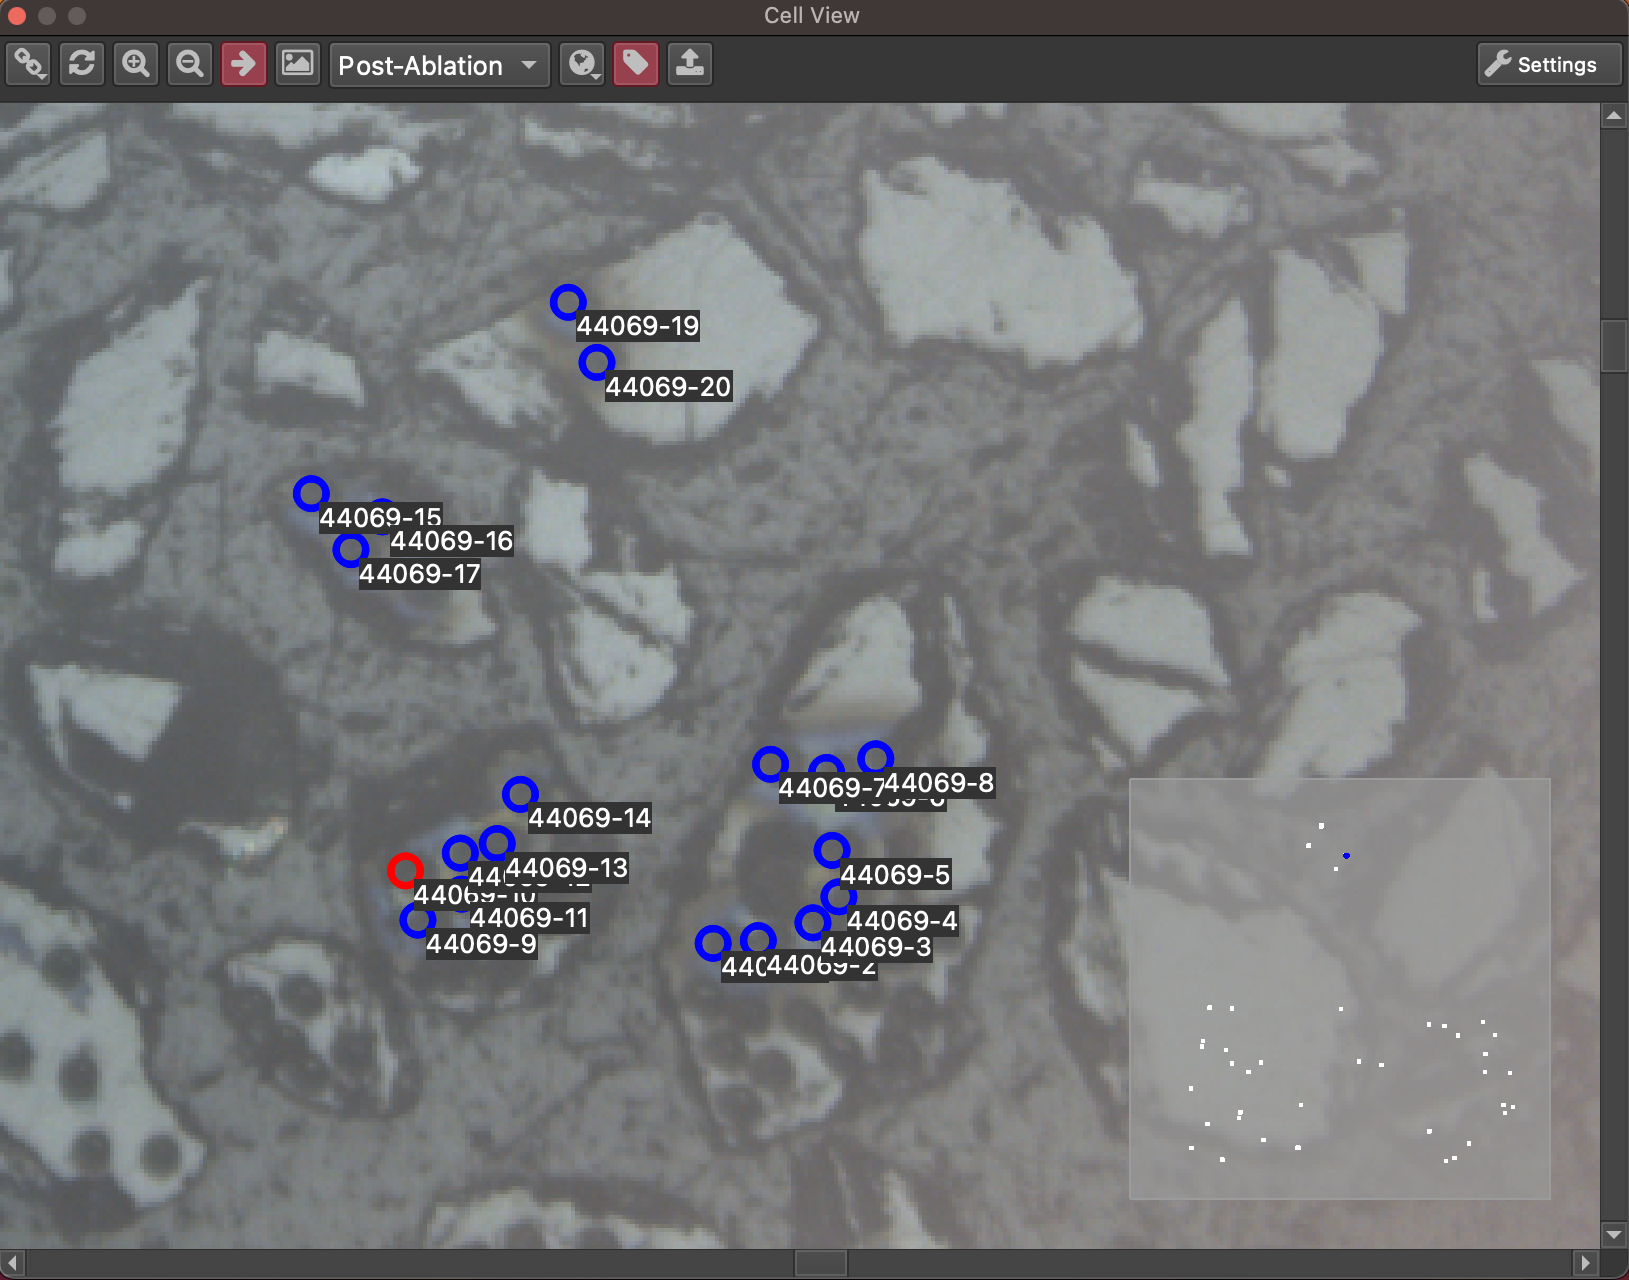
Fig. 17 An example of the CellView tool interface
Cell View can be enabled by going to the Visualization menu and toggling “Cell View”. It is a dock widget, meaning it can be moved and placed along any edge of the iolite window (by clicking and dragging its header) or it can be popped out and used as a separate window (by clicking the button beside the ‘x’ in its header). The main part of the window shows the selection geometry and images, and the bottom right shows a mini map of the entire cell to help keep track of where you are in the cell and the extent of your main view (blue rectangle in the mini map). The functions of the main toolbar are highlighted in a section below.
In the main view, you can click an analysis to make it the active selection and zoom to its time in the time series view. You can zoom into the mouse location by holding down control (or command on Mac) and using the mouse wheel. You can pan the main view by holding down shift + clicking and dragging. You can also move the main view by clicking in the mini map.
How it works
When selections are created in iolite from a laser log, the coordinates and shapes recorded in the laser log for each sample are transcribed to each selection as properties. You can also associate an ActiveView2 LAX file or ImageLog folder created by your laser ablation software – this will try to match selection names to pattern names (LAX) or file names (ImageLog), creating an additional “image” property for each matching selection. When the Cell View scene is updated, we iterate over the selections and create a graphical representation for each using these properties. Additionally, if using an ActiveView2 LAX file, any sample maps stored in the file are available to display in Cell View as well.
Toolbar

From left to right the buttons are:
Associate: displays a menu to select whether you would like to associate an ActiveView2 LAX file or ImageLog folder. Choosing one of the options will prompt for a file or folder.
Update scene: updates the scene based on the current selection properties. The scene will be updated automatically when associating a file, but if you are only viewing selection geometry or are manipulating selection properties via scripts, you may need to invoke this manually.
Zoom in: scales the view by 1.5x.
Zoom out: scales the view by 1/1.5x.
Zoom to current selection: translates and scales the view to the current active selection. This can be useful if, for example, you’ve found something interesting in the time series view and would like to visualize where the analysis was. If this is toggled on, each time the active selection changes, the CellView window will update to show the active selection.
Show current image: opens a window with the full resolution image of the current active selection.
Pre/Post-Ablation: controls whether we use pre or post ablation images. It also changes the order in which the images are drawn. If viewing pre ablation images, they are drawn in reverse chronological order. This way, if two images overlap, you don’t see the post ablation pit of a previous analysis on the pre ablation image of the next.
Sample maps: opens a menu of sample maps detected in an associated ActiveView2 LAX file. Individual sample maps can be toggled on or off in the menu.
Selection labels: toggles whether the selection names are drawn in the scene.
Export images: opens a dialog that allows you to export all the associated images in the desired format and quality (see below).
Settings: opens the settings dialog (see below).
Export Images Dialog
The export images dialog is shown below. You can select which format you want to export the images as (png, jpeg or tiff), and the quality (i.e., higher compression/smaller files/worse quality OR lower compression/larger files/better quality). You can also set which folder to export to by clicking the ... button on the right. The type of images to export (pre, post or both) can be selected with the dropdown menu. You can choose which selection group(s) images will be exported for (by default all selection groups are selected).
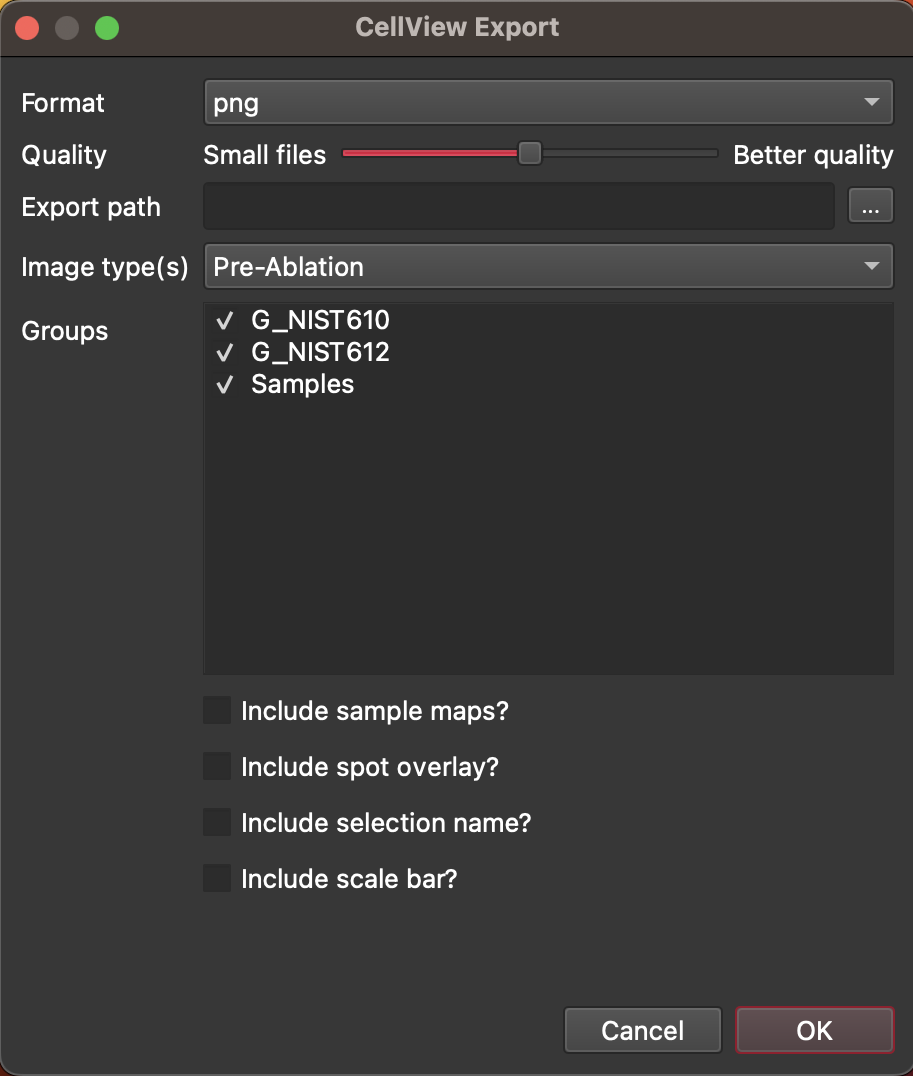
Fig. 18 A screenshot of the CellView Export Dialog
By checking the 'Include sample maps?' checkbox, sample maps will also be exported (even if they are not shown in the main CellView window).
The 'Include spot overlay?' checkbox toggles whether the blue circle showing the spot location will be included in the exported images.
The 'Include selection name?' checkbox toggles whether the selection label will be included in the exported image. The label is placed in the top left of the exported image.
The 'Include scale bar?' checkbox toggles whether a scale bar will be added to each export image. When checked, a field will appear where you can type in the scale bar length in microns. The scalebar will be placed in the bottom left of the exported image.
Settings Dialog
The settings dialog is shown below followed by a brief description of each setting.
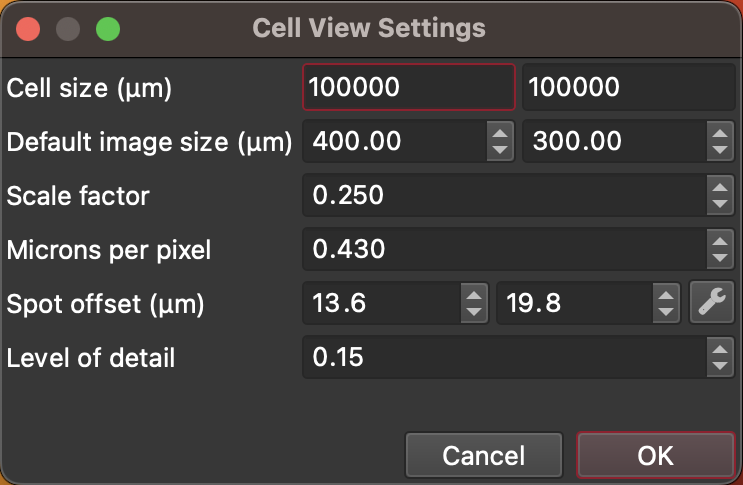
Fig. 19 The CellView Settings Dialog
Cell size: the dimensions of your cell in micrometers.
Default image size: the size of the gray rectangle shown before images are loaded (i.e., when you’re zoomed out).
Scale factor: allows you to reduce the resolution of the displayed image. Generally, lower resolution means faster navigation, and less memory consumed.
Microns per pixel: the number of microns per pixel that your images were captured with. If the selection shapes drawn on top of images don’t match the ablated area, this parameter may need adjusting.
Spot offset: spots are expected to be at the centre of images, but if they’re not, you can use this setting to adjust for it. You can either adjust this offset using the x and y values shown, or click the wrench icon button to show the Spot Offset Adjustment window (shown below).
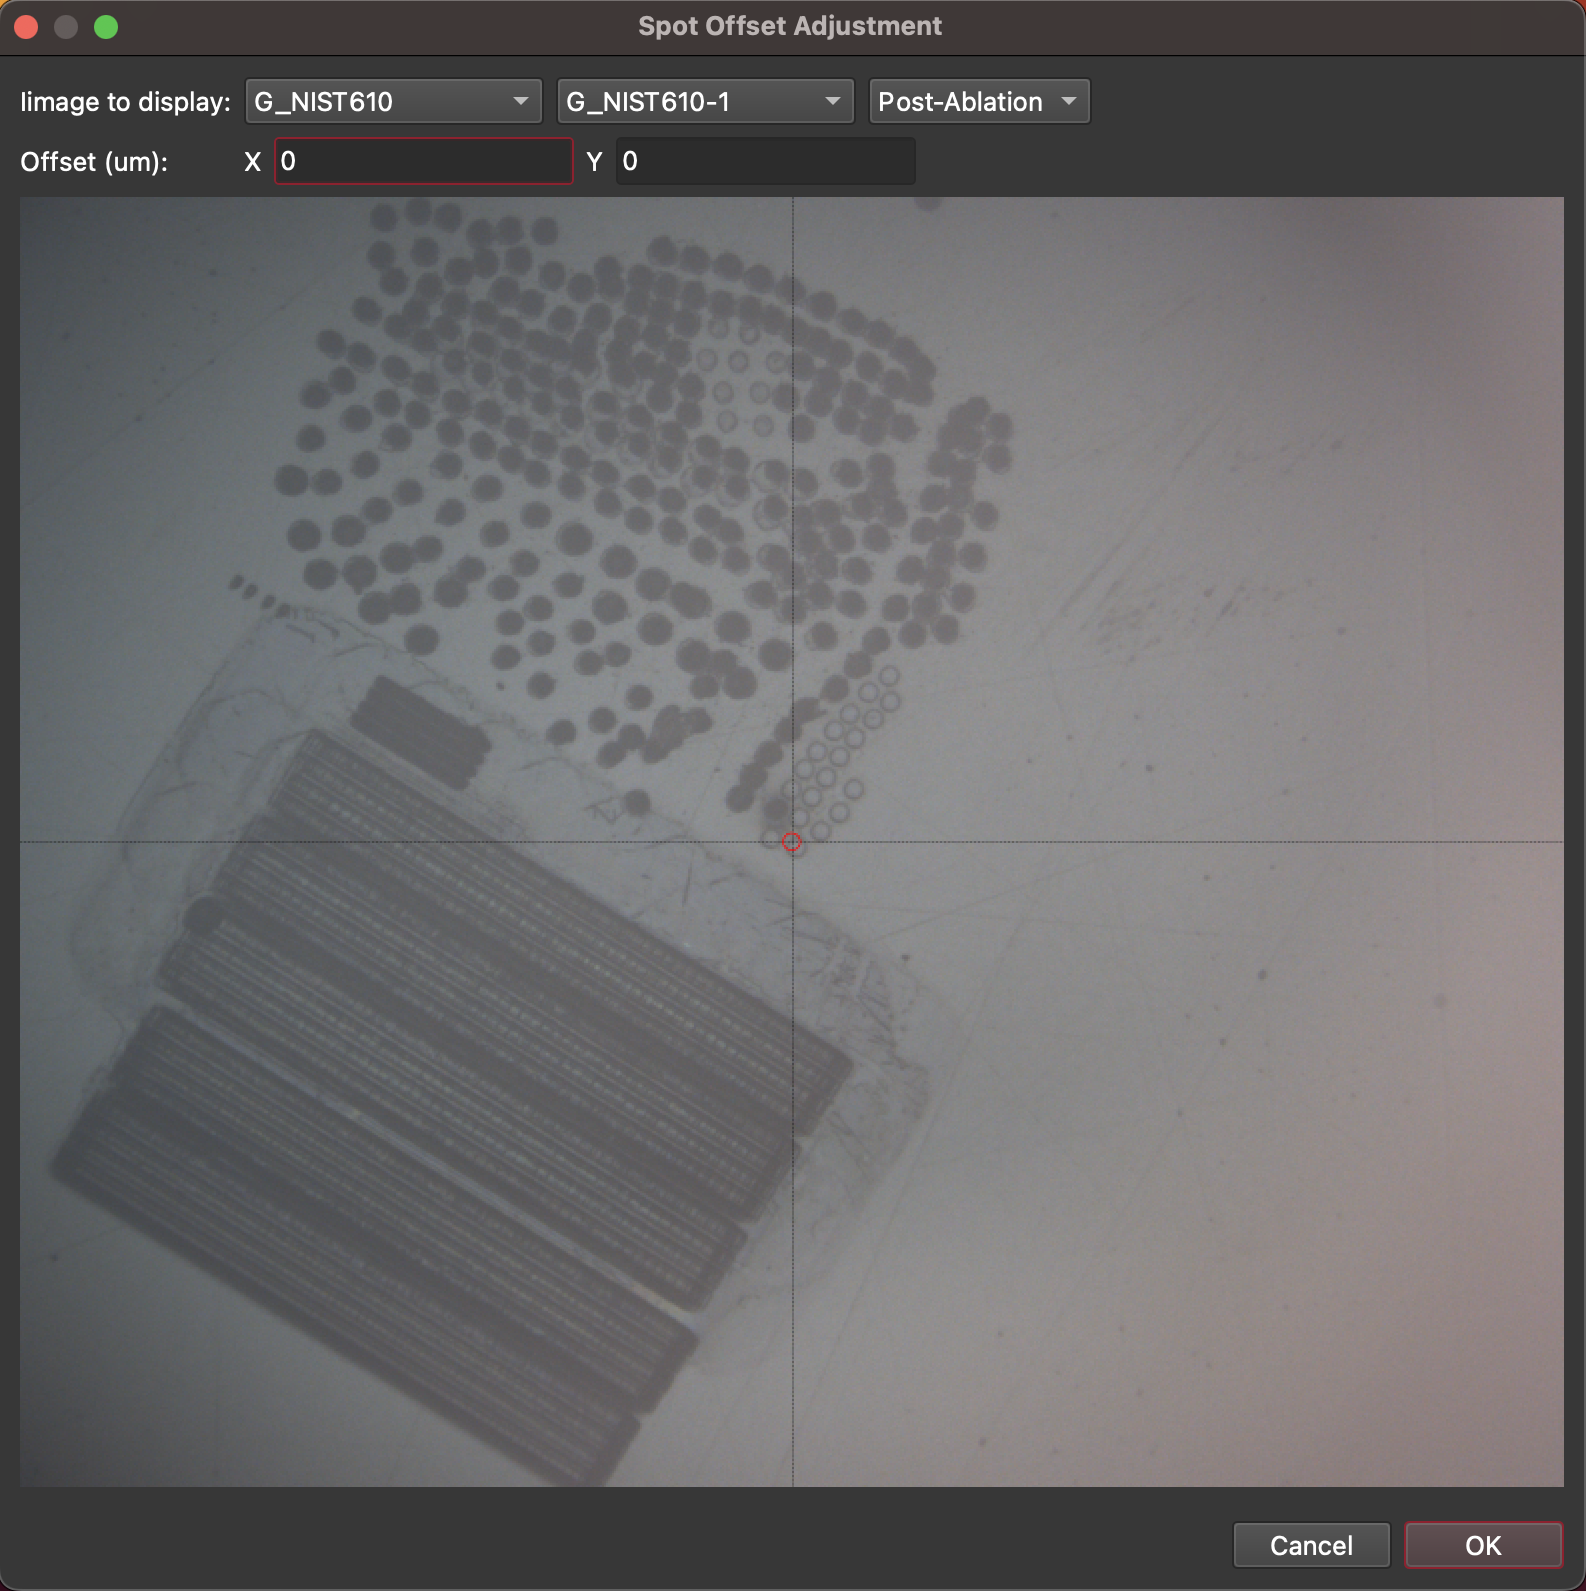
Fig. 20 The CellView Spot Offset Adjustment window
Using this window you can choose a selection to view (at the top) and whether to view the pre- or post-ablation image (typically the post-ablation image will be more useful). The crosshairs shown on the image show and offset of 0,0. You can click on the actual ablation pit shown in the image and the image offset x and y will be updated. When you have selected the correct offset, click OK. To save the settings click the OK button at the bottom of the Settings Window. In the main CellView window, click the refresh button (second from left) to apply the new offset.
Level of detail: controls the zoom level at which the images will be loaded. A smaller number means they’ll be visible when zoomed out more. Range is 0.02 to 1.