Using Gelatin Reference Materials with 3D Trace Elements
Gelatin standards are becoming more widely used in bio-LA-ICP-MS because their creation can be automated using micro-array spotters, and they can be doped with elements of interest in a range a concentrations appropriate to the samples in the study.
A major drawback of using gelatin droplets however is that the distribution of the elements of interest is heterogeneous (e.g. a coffee stain effect) requiring the entire droplet to be ablated c.f. the established approach of a single scan line on a homogeneous reference material.
Because concentration is not constant over the area of the droplet, the typical calibration curve of intensity relative to concentration cannot be used. Instead, each droplet is ablated and the sum of counts for the droplet is plotted relative to the total mass of the element of interest. This produces a calibration curve (or calibration surface in 3D Trace Elements) with a gradient in counts per gram (or more commonly, fg). To determine the concentration for any individual measurement then requires normalising to the ablated mass.
The ablated mass  for measurement
  (in g) is (adapted from Schweikert et al. (2022): https://link.springer.com/article/10.1007/s00216-021-03357-w)
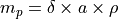
where  is the thickness of the ablated material (in cm),
  is the ablation area (in cm²), and
  is the density of the material (in g.cm⁻³)
and the concentration  of element
  for any measurement , (also adapted from Schweikert et al. (2022): https://link.springer.com/article/10.1007/s00216-021-03357-w) is

where  is the intensity of element at measurement (in CPS),
  is the sensitivity of element (in CPS.g⁻¹), and is the mass of ablation at measurement (from equation above).
Suggested Workflow
Ensure your version of the 3D Trace Elements DRS is v1.2 or greater. You can either use iolite's builtin tools for updating the DRS (at startup) or by manually downloading the latest version from iolite's GitHub repo: https://github.com/iolite-LA-ICP-MS/iolite4-python-examples/tree/master/drs
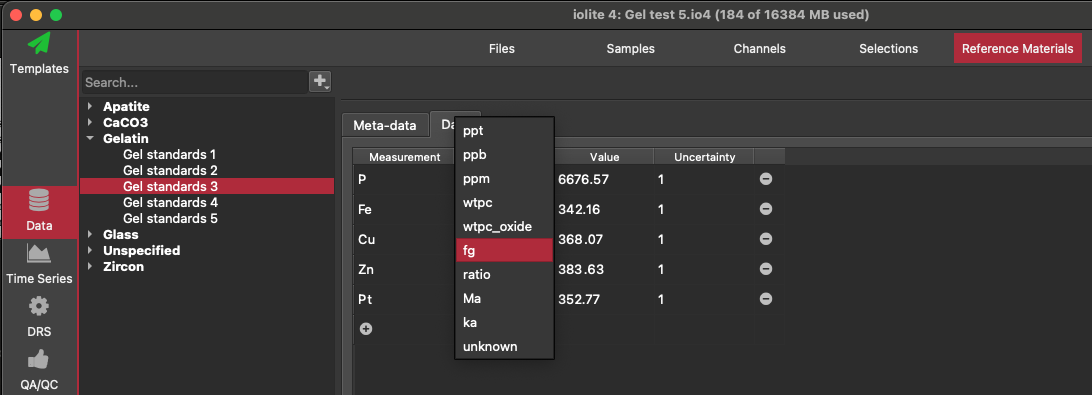
Ensure you have a reference material set up for each concentration. Also make sure that the units for each element in the reference material used the 'fg' units.
Import data and laser log file
Create baseline selections
Create groups for each group of droplets
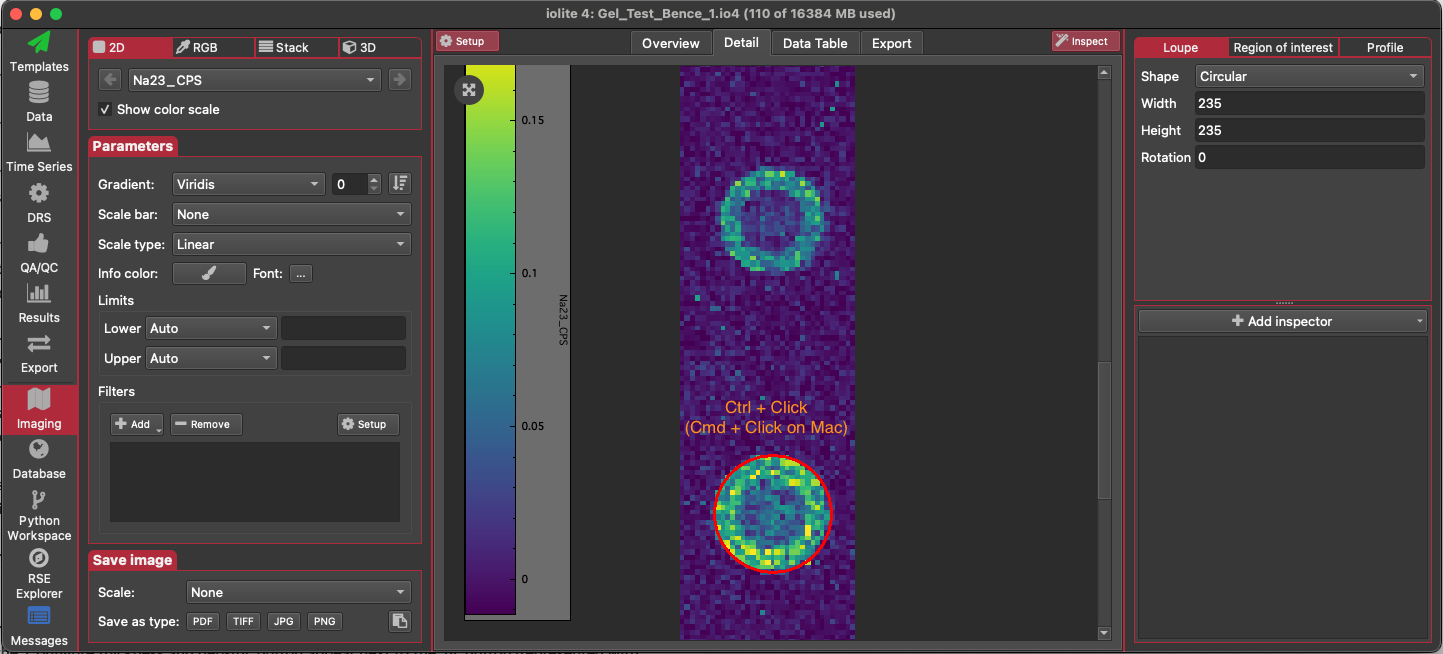
Create images for each group of droplets. You can initially pick just one channel where the images are clearly defined (e.g. Na23).
Create an ROI for each droplet. This is most easily done using the Loupe. Set the diameter of the loupe to match the diameter of the droplets. Hold Ctrl (Cmd on Mac) and left click with the loupe centred on each droplet. This will create an ROI from the loupe's position. Name the ROI.
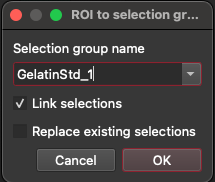
After creating an ROI for each droplet, go to the list of ROI. Right-click on each ROI in the list and select 'To selection group'. If a group for this gelatin reference material does not exist yet, create a new group (the name of the group must match the name of the reference material exactly). If the group already exists, make sure 'Replace Existing Selections' is not checked. Check the 'Link selections' checkbox to create a single linked selection for the droplet. Click OK.
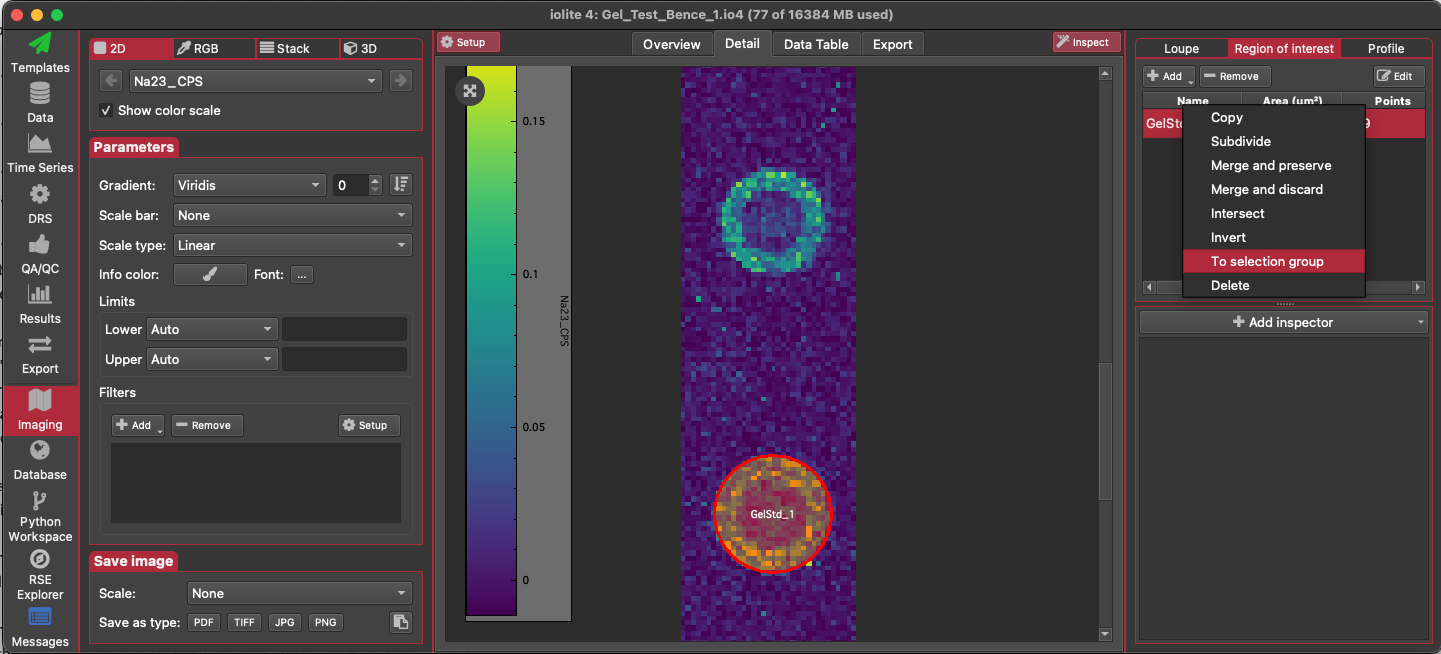
You should now have a linked selection for each droplet (similar to the image below: the orange rectangle represents the linked selection). Go to the 3D Trace Elements DRS in the DRS View. Set the reference materials to be used in the list of channels.
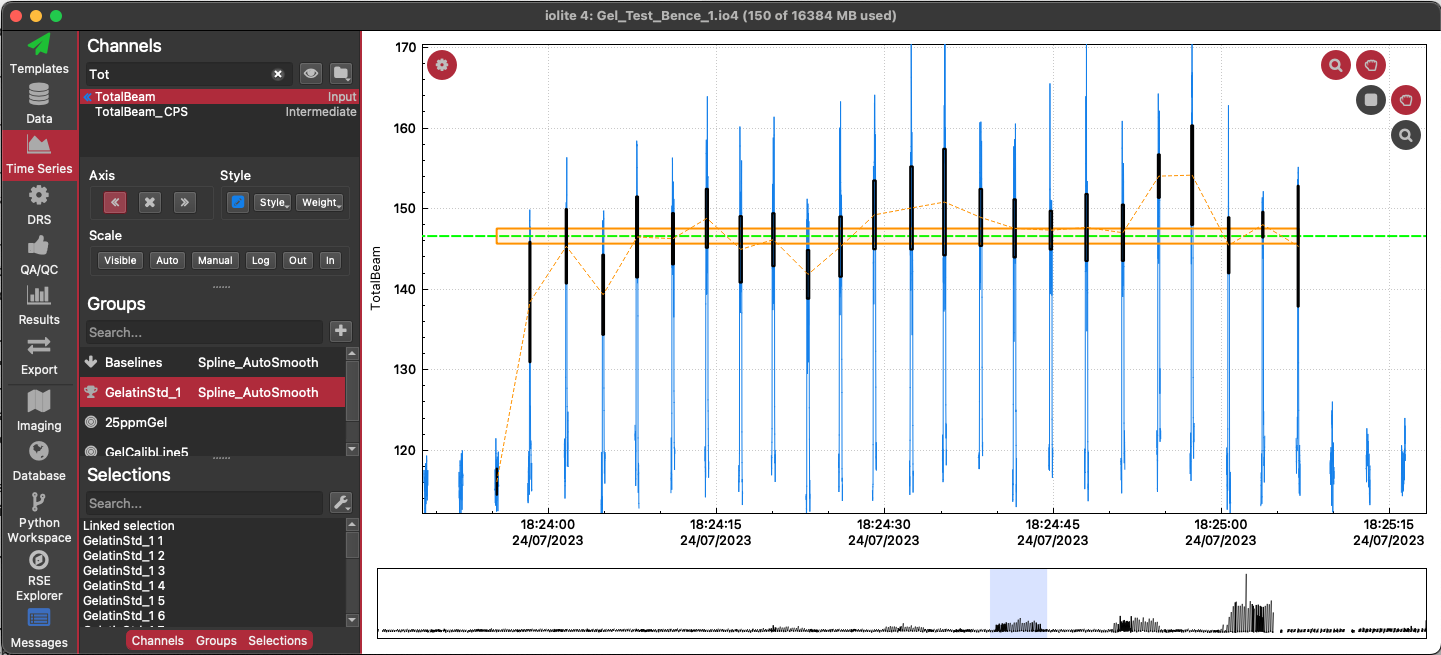
Change the statistic to be used in the calibration to 'Sum' using the 'Stat.' options menu (next to the spline type dropdown menu, above the 3D plot).
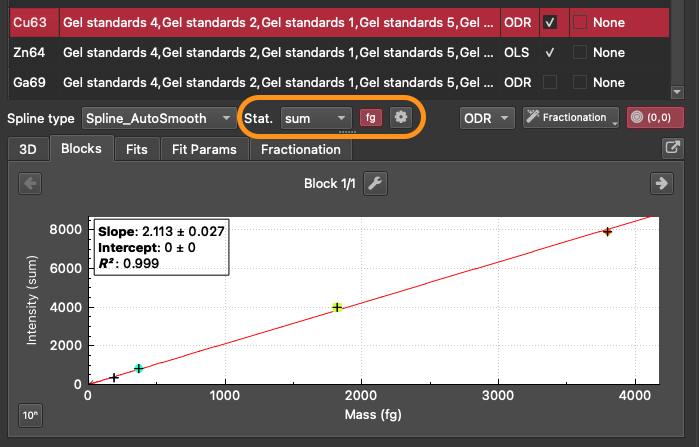
Change the calibration to use CPS/fg by clicking the 'fg' button (next to the Stat. button). This will make the 'Configure thickness and density' button appear next to the 'fg' button (represented with a cog icon).
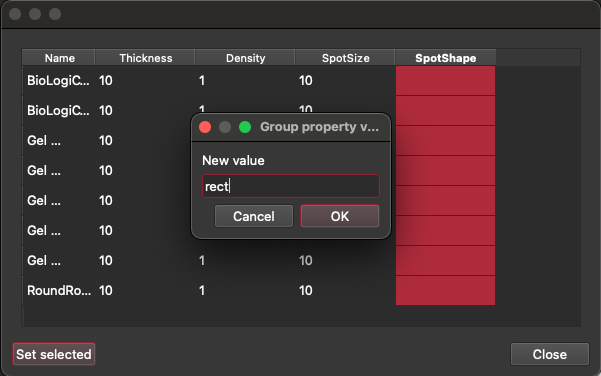
Click this 'Configure thickness and density' (cog icon) button. This will show a table where you can set the thickness, density, spot size and spot shape. Note that you can set the value for all selection groups at once by selecting all the rows in the column and clicking the 'Set selected' button (bottom left) and entering a value. This value will then be set for all selected groups. Hovering over each column header will tell you what units are expected in each column. For spot shape, the expected values are either rect or circle. Click the 'Close' button when done entering values.
Click the Crunch Data button. In addition to the output ppm channels, calculated according to the equations above, there will be a new intermediate channel 'AblatedMass' that corresponds to
in the equations above.If you have any issues with the workflow, please contact us via the iolite support email address.