TvTuner
Introduction
TvTuner (TvT) is a plugin for ActiveView2 (AV2) that allows the analyst to determine the optimum gas flows and z-offset for an experiment. The plugin can automatically adjust the Cell and Chamber gas flows and/or the z-offset and measure simple scan lines. The plugin then determines the average peak width and height for each set of parameters to help the analyst determine the best sensitivity and fastest washout conditions.
Parameters are varied in a series of Steps. The analyst can set which Parameters (e.g. Cell gas flow rate, z-offset, etc) are adjusted within each Step, including the start and end values, and how big the change between each value.
Steps are collected into a Procedure. Procedures can be saved and re-used in future experiments.
The results of running a Procedure can be stored in the plugin’s Library. Here the results are stored by date so that you can compare tuning parameters and peak width/height between experiments. Results can also be emailed to ESL support to help diagnose any performance issues.
TvT can also be used to determine the average peak width and height for the current setup.
Before you begin
You should ensure that you are running AV2 v1.5.1 or later. iolite v4.8 or later should also be installed on the laser computer, and be registered (a trial will not work). You should open iolite and import a file from your mass spectrometer to ensure that, for example, the timestamp format etc is set and iolite is able to import your mass spectrometer files.
The TvTuner plugin can be downloaded from the iolite store. Run the installer, and activate the plugin in AV2’s Manage Addin settings.
The plugin can automatically receive data from the mass spectrometer using the Chronicle File Watcher (CFW). CFW should be installed and set up before using TvT.
A brief overview of the user interface is included below, followed by an example workflow.
User Interface
The user interface is divided into four tabs:
Tune
Library
Editor
Settings
Tune
The Tune tab is where you can select a Procedure, create laser patterns for the Procedure and run then. It is also where the results for the current Procedure will be visualised as results become available. See Selecting and Running a Procedure below for more details on running a Procedure. See Editor for more details on creating and editing Procedures.
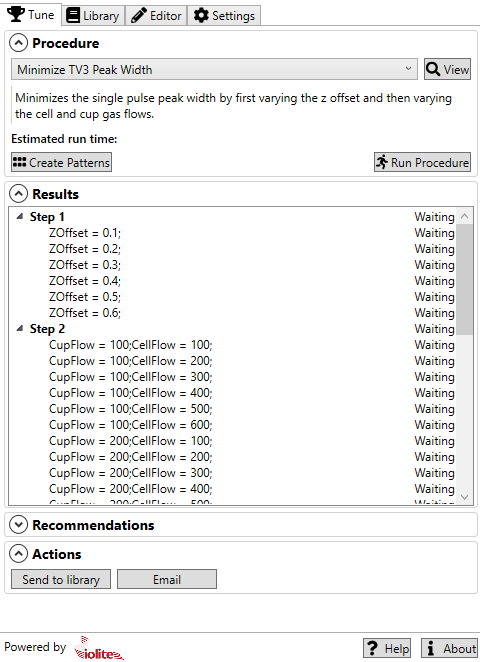
The Tuning Tab
Recommendations, such as XXXX will also appear in this tab.
In the Actions section, you can click the ‘Send to library’ button to store the results of the current Procedure to TvT’s library (see below), or you can click the ‘Email’ button to send the results to a third party (such as ESL support).
Selecting and Running a Procedure
By default, TvT comes with three built-in Procedures:
- Current Single Pulse Response
Creates a single tuning ablation line that can be used to determine the current single pulse response (SPR) for the current laser conditions.
- Minimise TV3 Peak Width
A two-Step Procedure that first optimises the Z-Offset (Step 1) and then optimises the Cup and Cell Flow rates (Step 2) for minimum peak width.
- Maximize TV3 Peak Height
A two-Step Procedure that first optimises the Z-Offset (Step 1) and then optimises the Cup and Cell Flow rates (Step 2) for maximum peak height.
If you have created your own Procedure (see Editor for how to create a Procedure) you can select it from the dropdown menu.
Once you have selected the Procedure you want to run, you can create the patterns (tuning ablation lines) for the Procedure’s Steps by clicking the Create Patterns button. You should position these patterns over your tuning sample so that they avoid any surface areas that may cause signal anomalies.
Once your patterns have been created, the Steps for the Procedure are added to the Results section of this Tab. Expanding each Step will show the ablation line associated with each combination of tuning values. Initially each Step and tuning line will have a status of ‘Waiting’. As results for each tuning line are received by the plugin, the status will change to ‘Processing’ as iolite reads in the data and determines the SPR for the tuning data, and then to ‘Complete’ once the results have been determined. If there is an error with processing the data, the status will change to ‘Error’.
When you are ready to run the Procedure, click the ‘Run Procedure’ button to start the Procedure. The ablation will begin after the tuning parameters have been set for each line in each Step.
If Chronicle File Watcher (CFW) is configured and working, the data for each tuning line should be sent automatically to the plugin after each line is finished. If CFW is not available, you can deselect it as a Procedure Option (see Editor) and a ‘Select Data’ button will be shown in the Results section of the Tune tab. Clicking the ‘Select Data’ button will allow the analyst to select a file containing all the tuning data.
Once some data have been received, clicking on the Step in the Results section will plot the results for that Step in the Results Plot. If the Step contains just one parameter being adjusted, the Results Plot will be a simple plot showing the mean SPR width vs the parameter being adjusted. If two parameters are being adjusted, the Results Plot will be a heat map showing the width as a color verus the parameters being adjusted.
For single parameter Steps (e.g. optimising the ZOffset) you can adjust which SPR value (peak width, height or area) is being displayed in the Results Plot by clicking the dropdown menu to the top left of the Results Plot. Selecting Width, Height or Area from the dropdown menu to the top right of the Results Plot will add that value to the right axis of the Results Plot (Fig. {number}).. You can zoom in or out on this plot using the mouse scroll wheel.
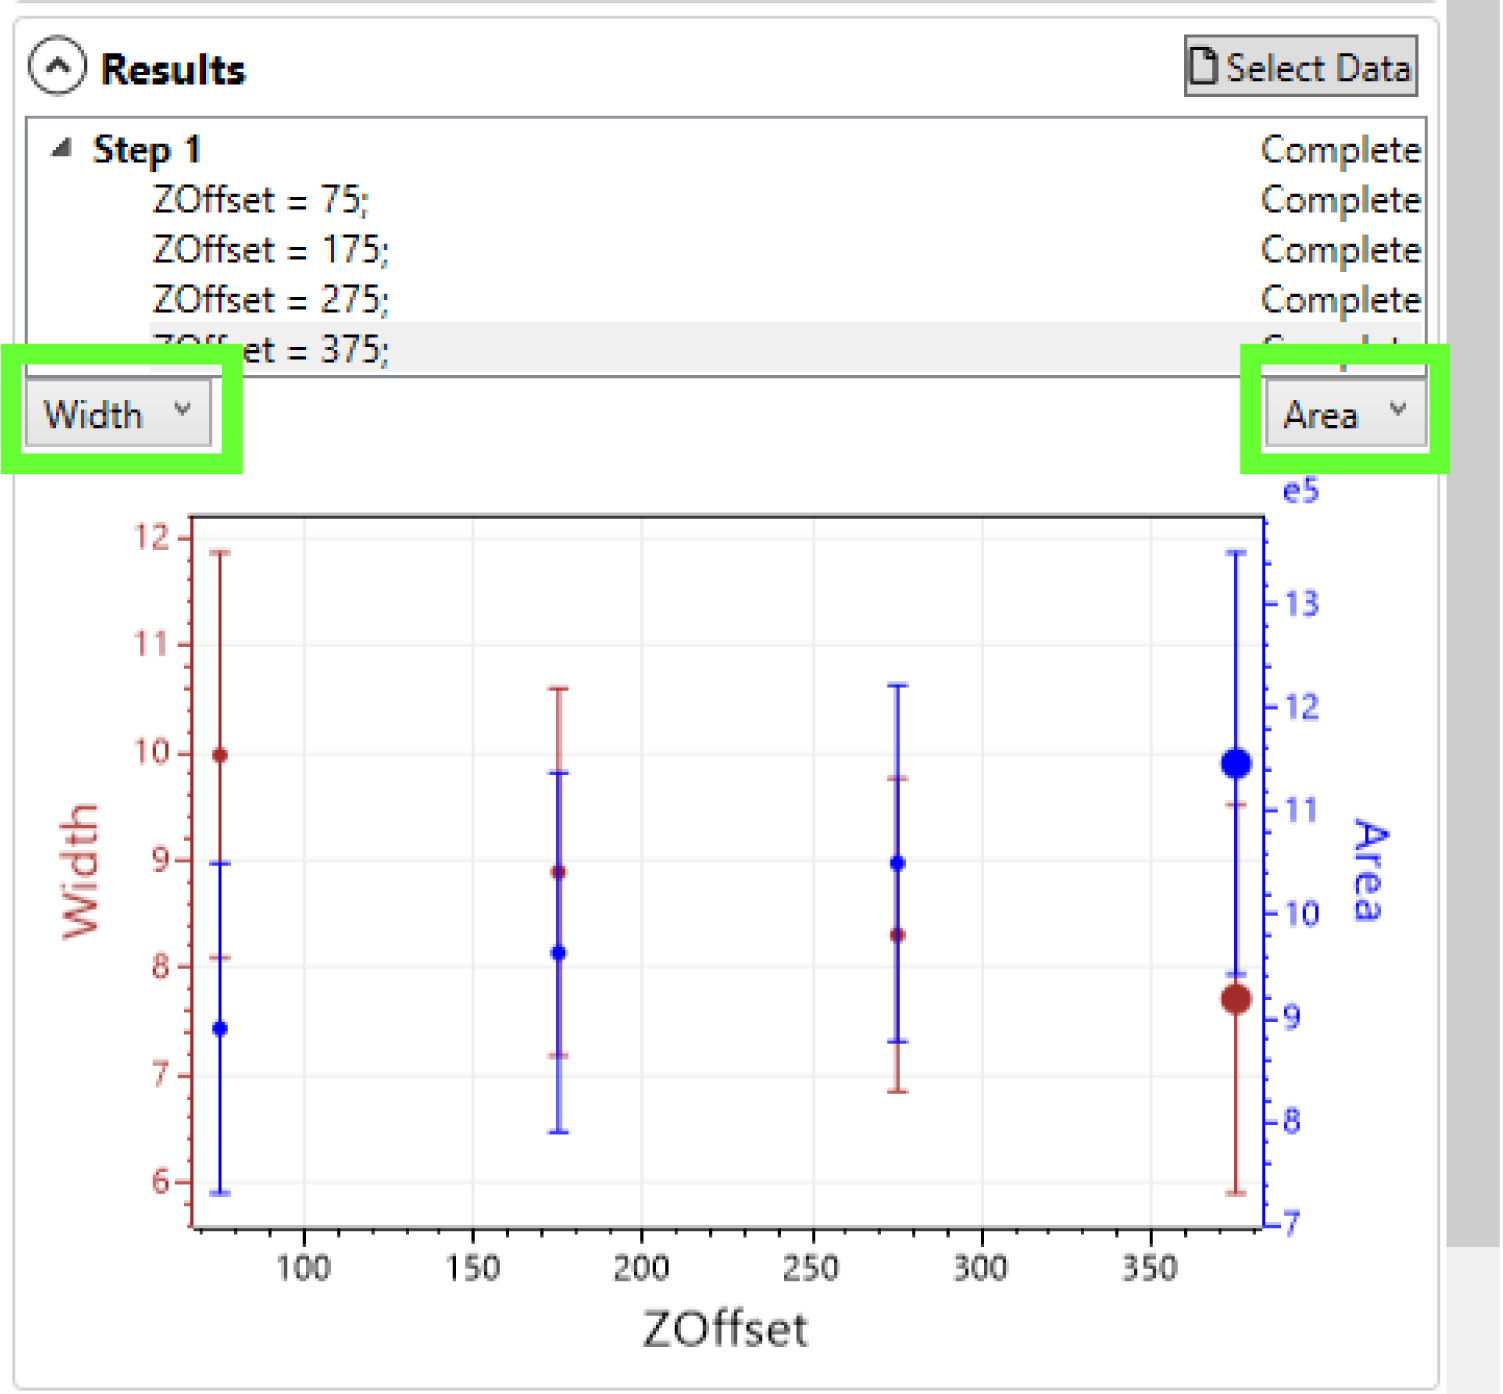
The Results Plot, showing the results for a single parameter tuning Step (in this case the Z-Offset). The dropdown menus for selection which value to plot on the left and right axes are highlighted in green. Note that the ‘Select Data’ button at the top right will only be available if CFW is disabled for the current Procedure.
Double-clicking on any tuning result in the Results Plot, or on the name of a tuning line in the list of Results, will open a window showing more details about that tuning line (Fig. {number}).
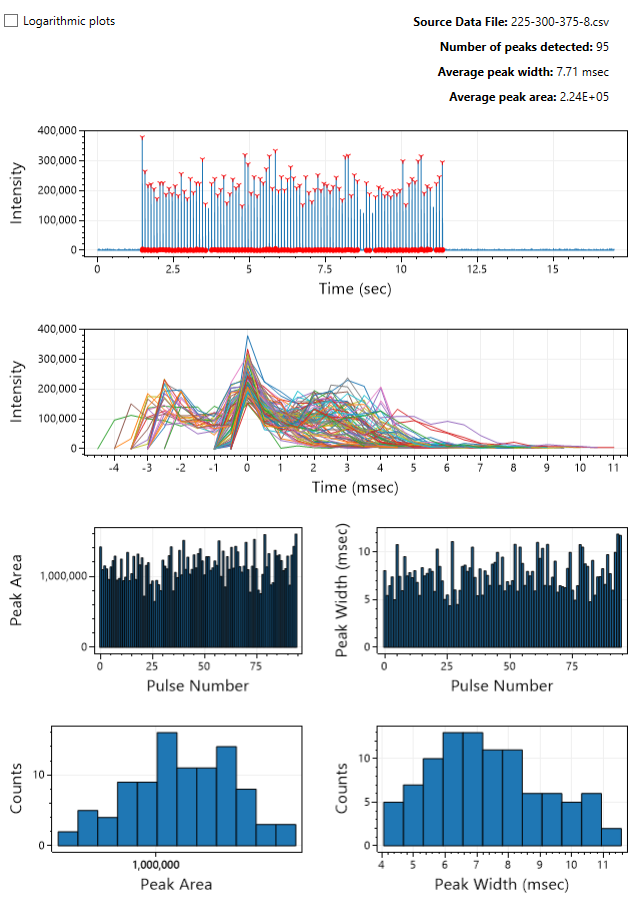
The Details Window showing full details of a tuning line, including the number of peaks found and the average peak width and height (top right).
In the Details Window, the top-most plot shows where the peaks were found, with the location of the peak max shown as a red ‘v’, and the position at which the width was measured marked by red filled dots. The second from top plot shows each peak found superimposed on each other peak to show mean peak shape. The third from top plots show the peak area and width in pulse order to show if these values are evolving within a tuning line. The bottom row shows histograms of the area and width to help describe the variation in these values. All plots can be zoomed using the mouse wheel. This window can be accessed by double-clicking on the name of a tuning line or by double-clicking a result in the Results Plot.
Library
The Library Tab allows you to review the results of previously-run Procedures. Selecting a set of results from the Saved Run section will display the results of that Procedure in the Results section. This Results section is the same as that for the Tune tab. You can also add notes about any set of results in the Notes field.
You can delete a set of results by right-clicking on it and selecting ‘Delete selected runs’.
You can email results using the ‘Email’ button.
Editor
The Editor Tab is where Procedures are created or edited. As mentioned above, TvTuner comes with three built-in Procedures. These can be used as templates for custom tuning Procedures, but cannot be edited or deleted. Any custom Procedures that you create can be edited/deleted.
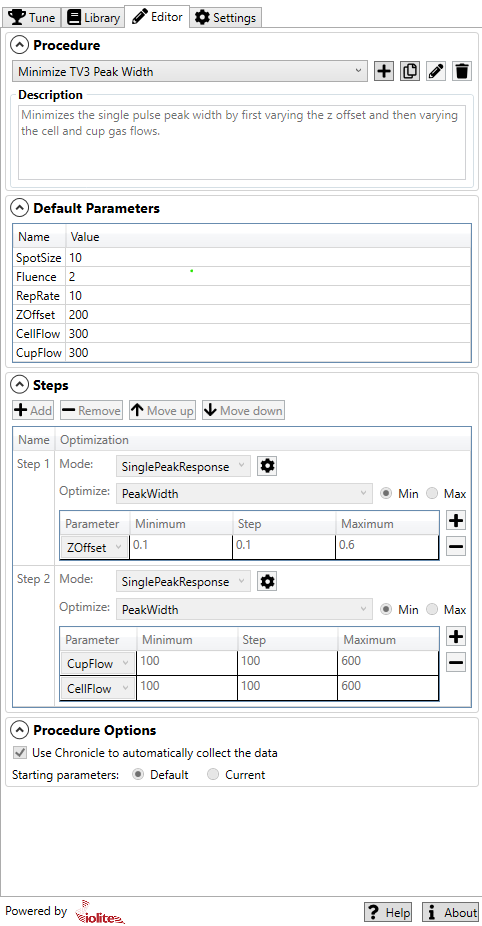
The Editor tab, where Procedures can be created or edited.
Selecting a Procedure from the dropdown menu at the top will show the Procedure’s default values, list of Steps and Procedure Options.
To add a new Procedure, click the button. To copy a Procedure, click the button. To edit the name of a Procedure, click the button. To delete a Procedure, click the button.
When creating a new Procedure, you will be prompted for a name for the Procedure. You can then also add an optional description of the Procedure in the Description field.
New Procedures initially have no Steps. You can add, remove and reorder Steps for the Procedure using the Steps section. Click the Add button to add a Step to a Procedure. The added Step will have a default name (e.g. ‘Step 1’), but this name can be edited by double-clicking the name. The Step’s Mode determines how the Step is analysed.
At the moment, SinglePeakResponse is the only available mode, but other modes such as ‘Steady State’ will be available in upcoming versions. Clicking the button to the right of the Step’s mode will will allow the analyst to set the number of pulses to be used in each parameter variation within the Step (default 100 pulses), the repetition rate of the laser (default 10 Hz), what percentage of the peak max to use to measure the peak width (default 1% of peak max), and the line spacing between tuning lines.
The Optimize option selects with value (peak width etc) will be optimized in the Step, and whether to select the minimum or maximum value.
The Parameter table shows the range of values, and the step size, for each tuning parameter. Clicking the adds a parameter for tuning; clicking the button removes a parameter.
The parameters available for tuning adjustment are: Cup Flow Cell Flow Z-Offset Fluence SpotSize, and RepRate
You can set the minimum and maximum values to use in the tuning runs in the Minimum and Maximum columns, along with the size of the step between tuning lines.
If you have multiple parameters to be tuned, TvTuner will automatically vary one parameter while keeping the remaining constant.
The options for the Procedure are whether to use CFW to automatically return the data for processing, and whether to use the current laser conditions as the starting point for any laser paramters that are not defined in the Steps table. If the current settings are not used, a set of default conditions will be used.
The Steps of a Procedure will be run in order. You can adjust the order of the Steps using the ‘Move up’ and ‘Move down’ buttons.
Settings
Here is the settings section
An Example Workflow
Before using the plugin to determine the optimum cell settings, you should have started the laser and mass spectrometer and run your typical tuning procedure. The plugin does not tuning any of the mass spectrometer settings, so it should be as accurately tuned as possible before running a Procedure.
A tuning sample should be placed in the cell and CFW should be fully set up.
Support
If you have any problems, suggestions or questions, please do not hesitate to contact us at support@iolite-software.com.
Glossary
- AV2
ActiveView2, the laser control software
- CFW
Chronicle File Watcher, an application for automatically sending files from the mass spectrometer computer back to AV2.
- Parameter
A tuning parameter, e.g. the Cell gas flow rate.
- Procedure
A set of tuning Steps, executed in order to determine the best overall tuning parameters.
- SPR
Single Pulse Response: the typical peak measured by the mass spectrometer from a single laser pulse. Typically the SPR is described by its height (the max counts over the peak) and its width. This plugin also reports the average peak area. The width is usually described at some percentage of the max height, e.g. the width at 1% of the max height. Due to the noise associated with any one pulse measurement, these values are usually reported as the average of many individual pulses.
- Step
A part of a Procedure where one or more tuning parameters are varied to observe the effect on the pulse signal (e.g. pulse height, pulse width etc) as measured by the mass spectrometer.
- Z-Offset
[Description of Z-Offset here….]